
Online Shopping Statistics: How Popular is Ecommerce in the USA 2021?

6 min reading - Aug 27, 2021

Millions of people now shop online rather than going to a store. And the small matter of a global pandemic and restrictions on our movement has only enhanced this. But just how big is online shopping, do we prefer it to an in-store experience and where are we spending more of our money?
We take a dive into the data with our online shopping statistics USA round up for 2021.
Online Shopping Statistics – The Quick Version:
Looking for the quick version? Here are our key findings (with more data within this article):
- Over 19% of the US population prefers online shopping over shopping in store.
- However, almost double that number (37%) still prefer to shop in store
- Amazon is the most popular retailer in the US (according to search volumes), with approximately 133 million Google searches for “Amazon” being made online every month nationwide
- Walmart and Home Depot follow close behind with 68.5 million and 46.9 million searches for their brand names per month respectively across the US.
Do People Prefer Online Shopping?
In March 2021, we surveyed 3,001 people in the USA to find out a little more about their online shopping habits. Using Google Surveys, we asked people which of the following statements applied to them:
- “I would rather shop online than in store”
- “I would rather shop in stores than online”
- “I prefer to shop on Amazon than other sites”
- “I prefer to buy from small business websites”
- “I spend more online than I do in-store”
- “I make online purchases at least once a week”
Here’s what we found out about the US population’s shopping preferences.
% of those in the USA who agree:
- I would rather shop in stores than online - 37.10%
- I prefer to shop on Amazon than other sites - 21.80%
- I spend more online than I do in stores - 20.70%
- I would rather shop online than in store - 19.30%
- I prefer to buy from small business websites - 17.50%
- I make online purchases at least once a week - 13.50%
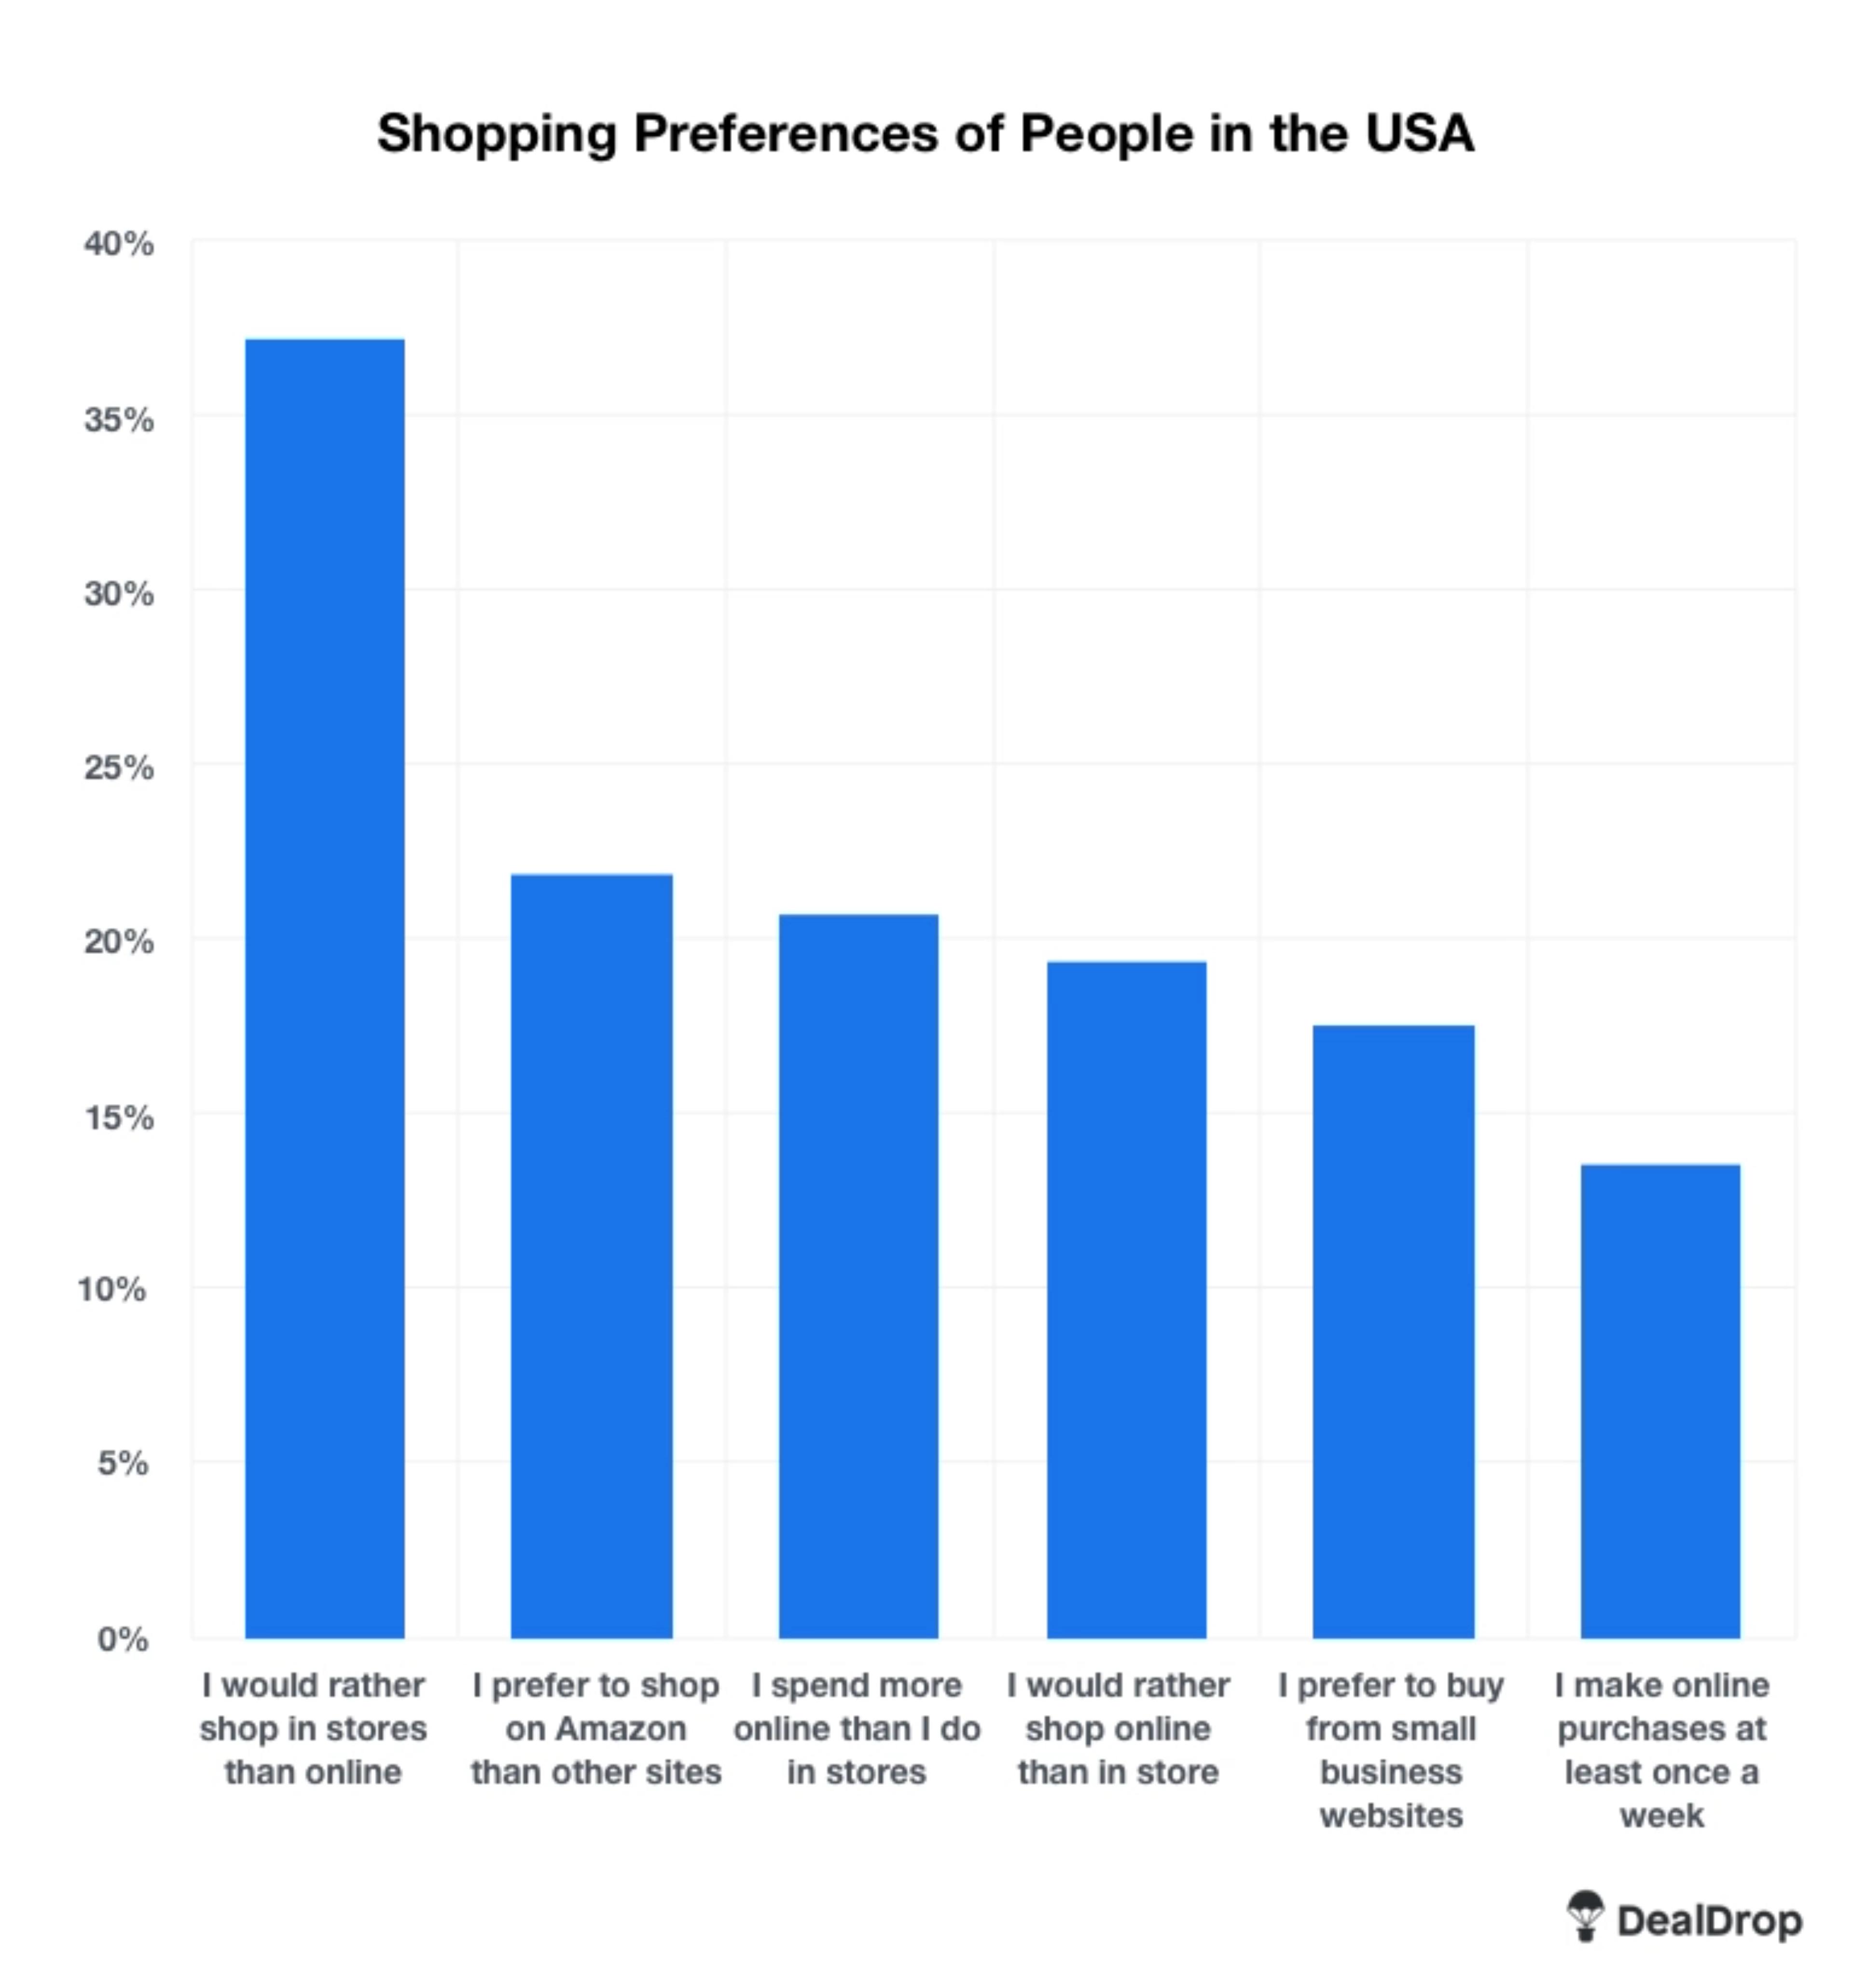
Google Survey issued to 3001 respondents. “Tick all statements that apply to you”
A huge 37% of people in the USA, according to our statistics, would still prefer to shop in a physical store. 19% prefer to shop online.
But interestingly, over a 5th of our respondents spend more online than they do in store.
Age Variations
Online versus offline shopping preferences vary by age quite notably.
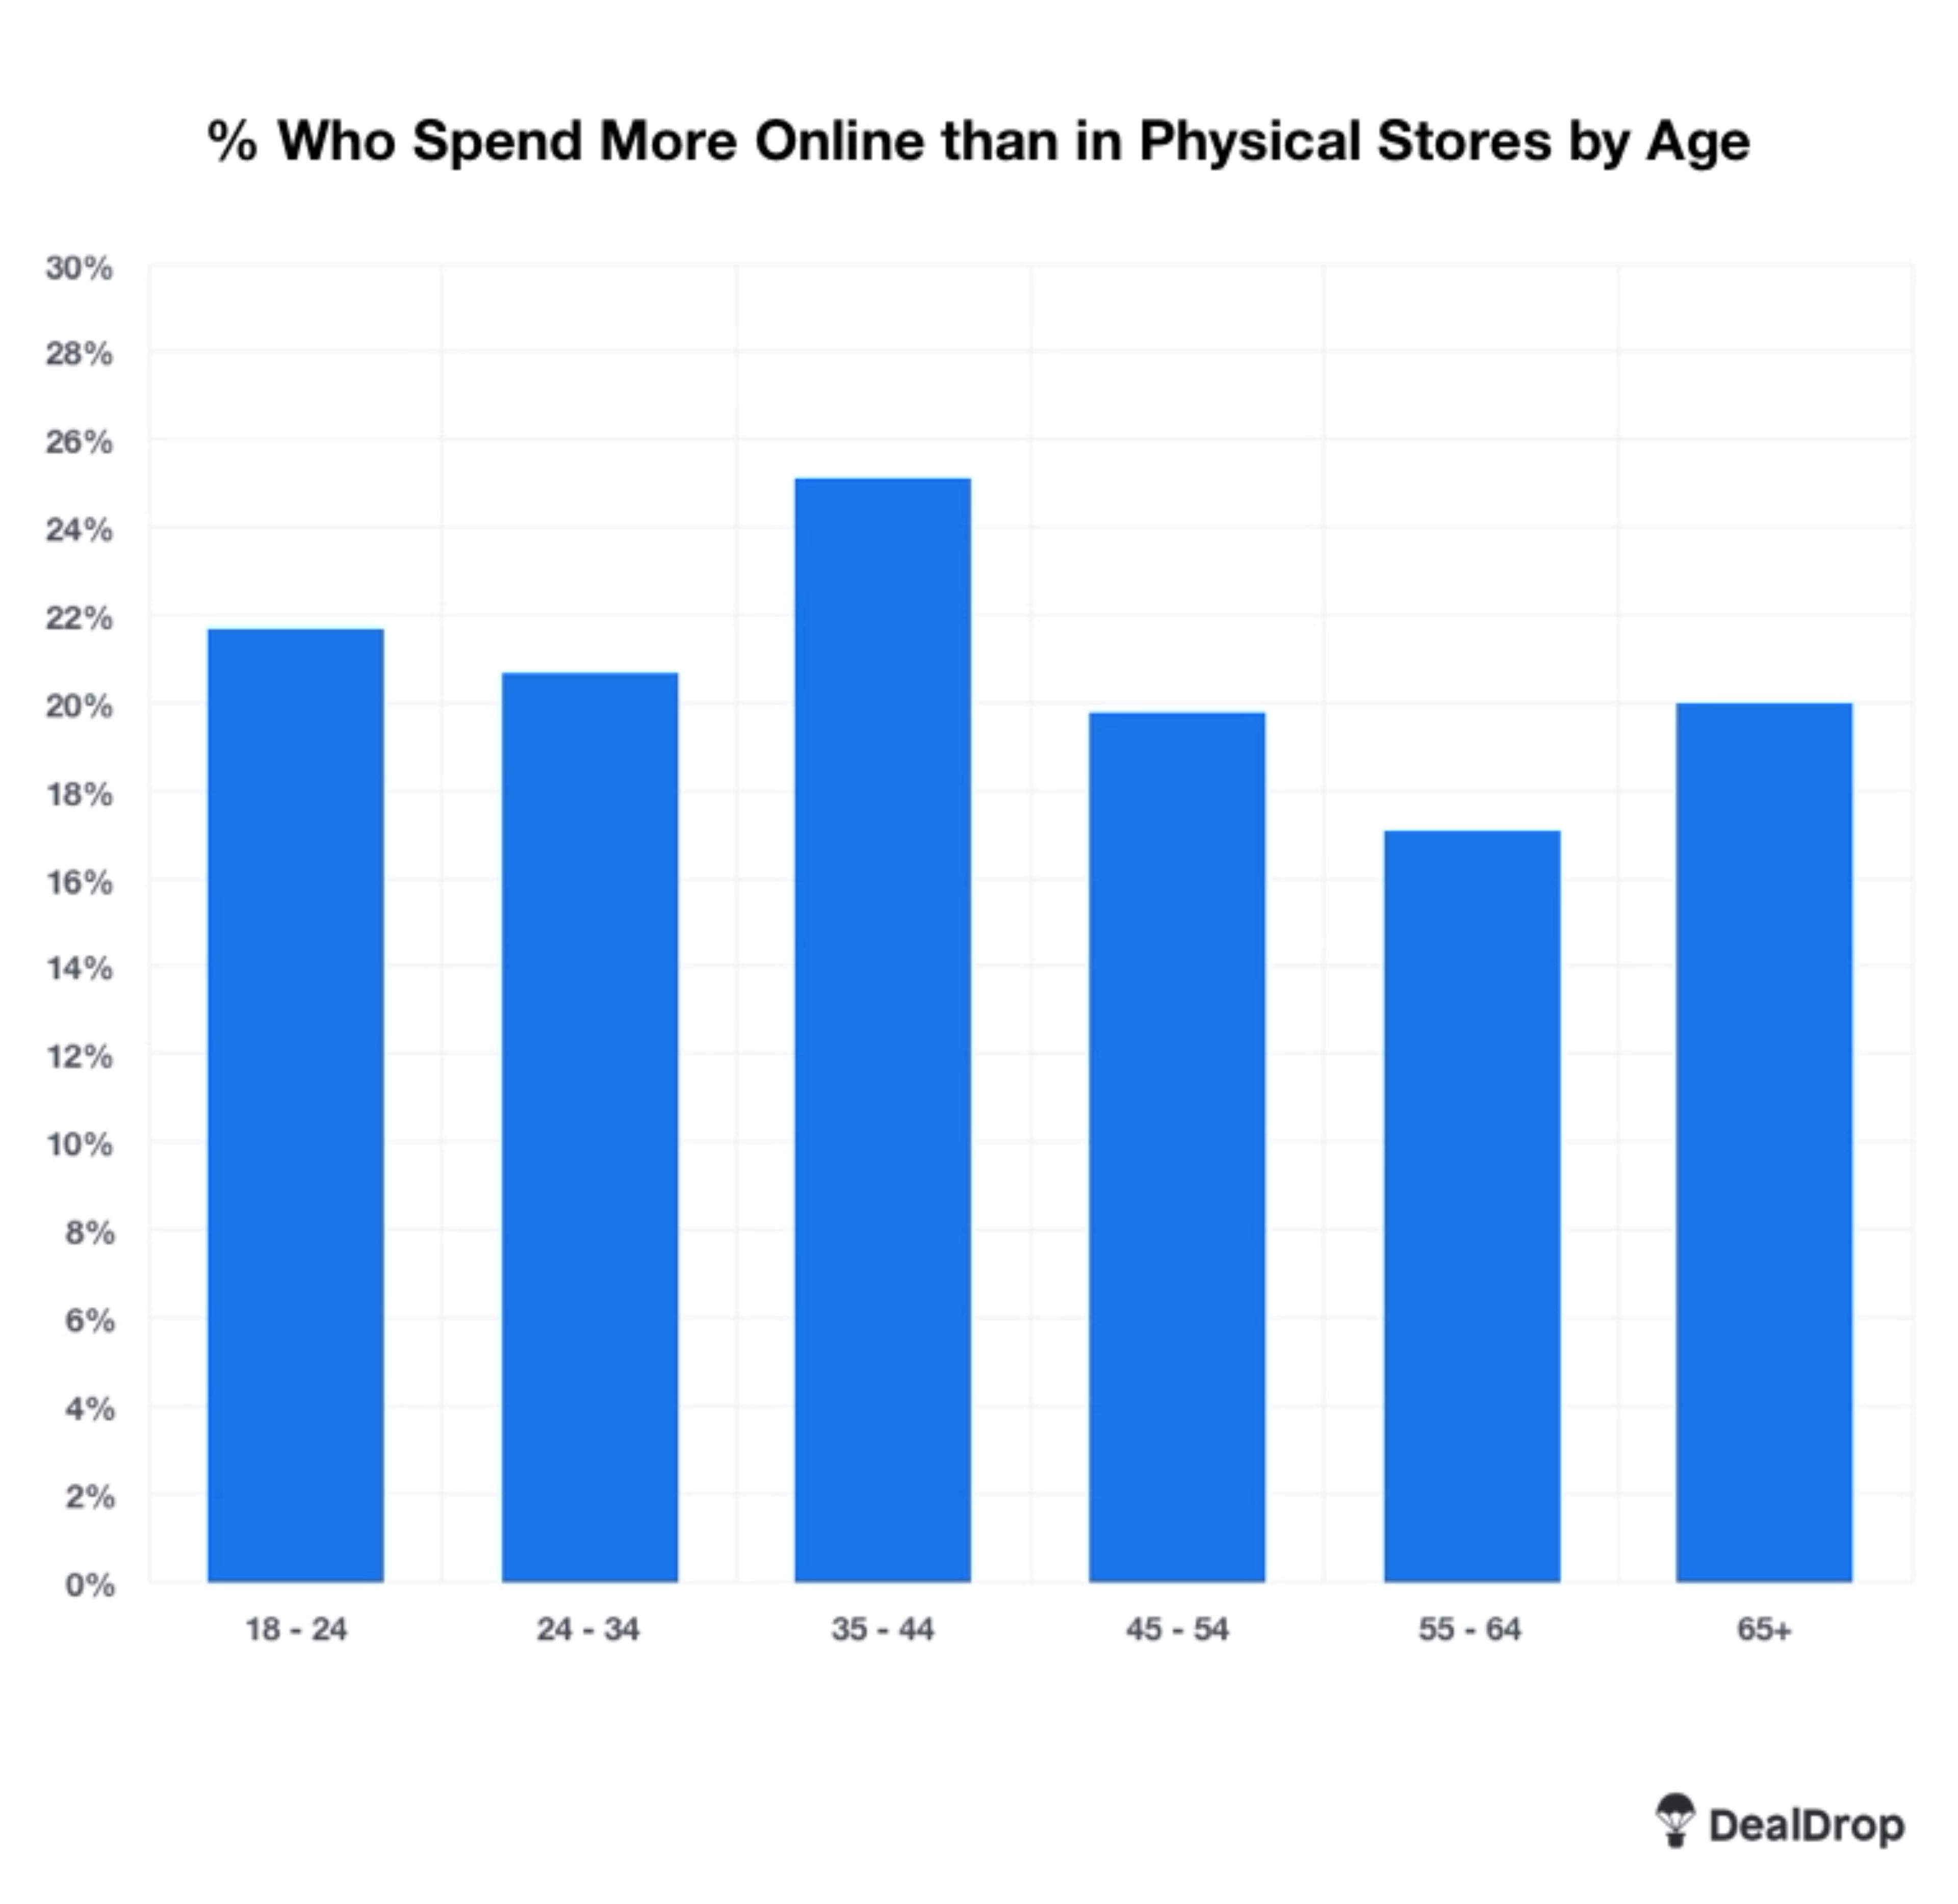
35 to 44s are the likeliest to find their spending weighted online, with a quarter of them claiming to spend more online than in physical stores. This drops to a little over 17% for the 55 to 64 year age category.
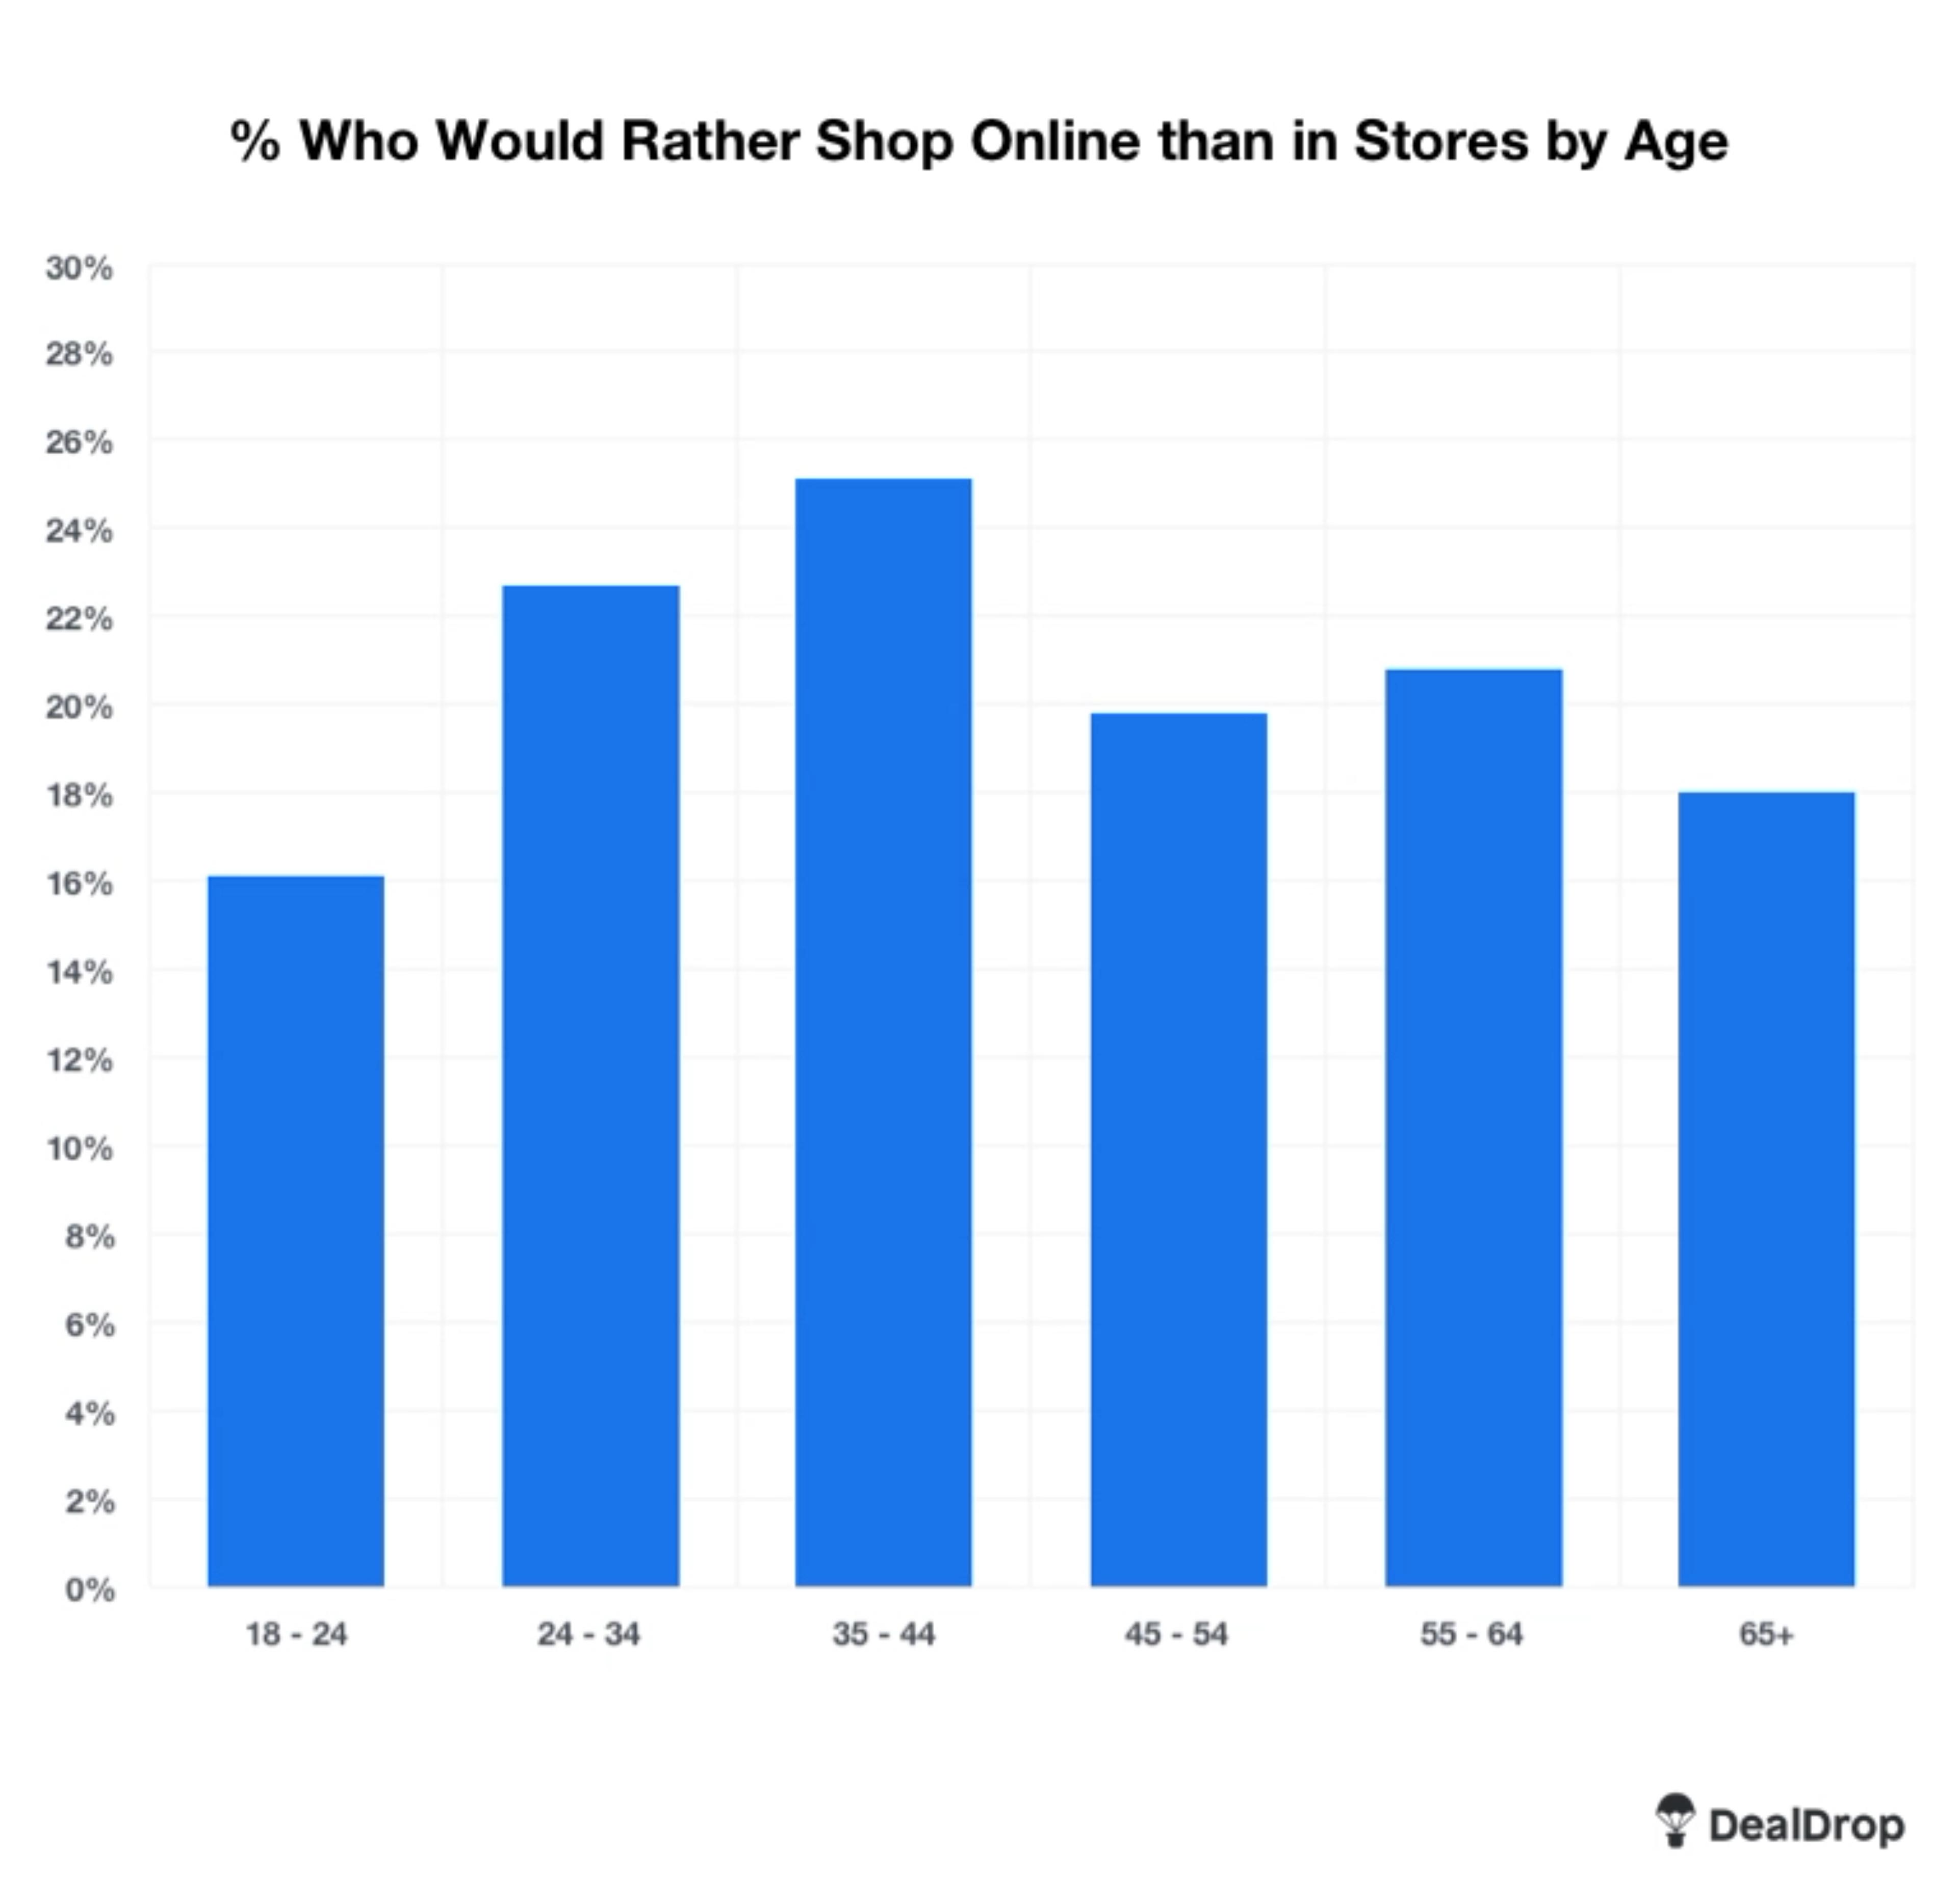
There are variations amongst age groups when it comes to a preference for online shopping too. Those aged 25 to 34 are the likeliest in the US to prefer online shopping according to our statistics (22.7%) while just 17.3% of those aged 45 to 54 state the same.
Amazon vs the Small Business: The David and Goliath of Online Shopping
Amazon is the internet’s one stop shop. Is there anything you cannot buy there?
So it comes as little surprise that the combination of competitive pricing, astronomical product range, often seamless delivery and quick checkout are winning over so many sales.
But what about the little online businesses? How do they fare in an incredibly competitive online shopping landscape?
We found:
- 21.8% of respondents in the USA prefer shopping on Amazon over other websites
- 17.5% prefer to buy from small businesses
So nationally, Amazon might just have the edge. But what about state by state? We put Amazon and the small businesses head to head and broke our data down to look at the 10 most populous states in the USA. Here’s what we found:
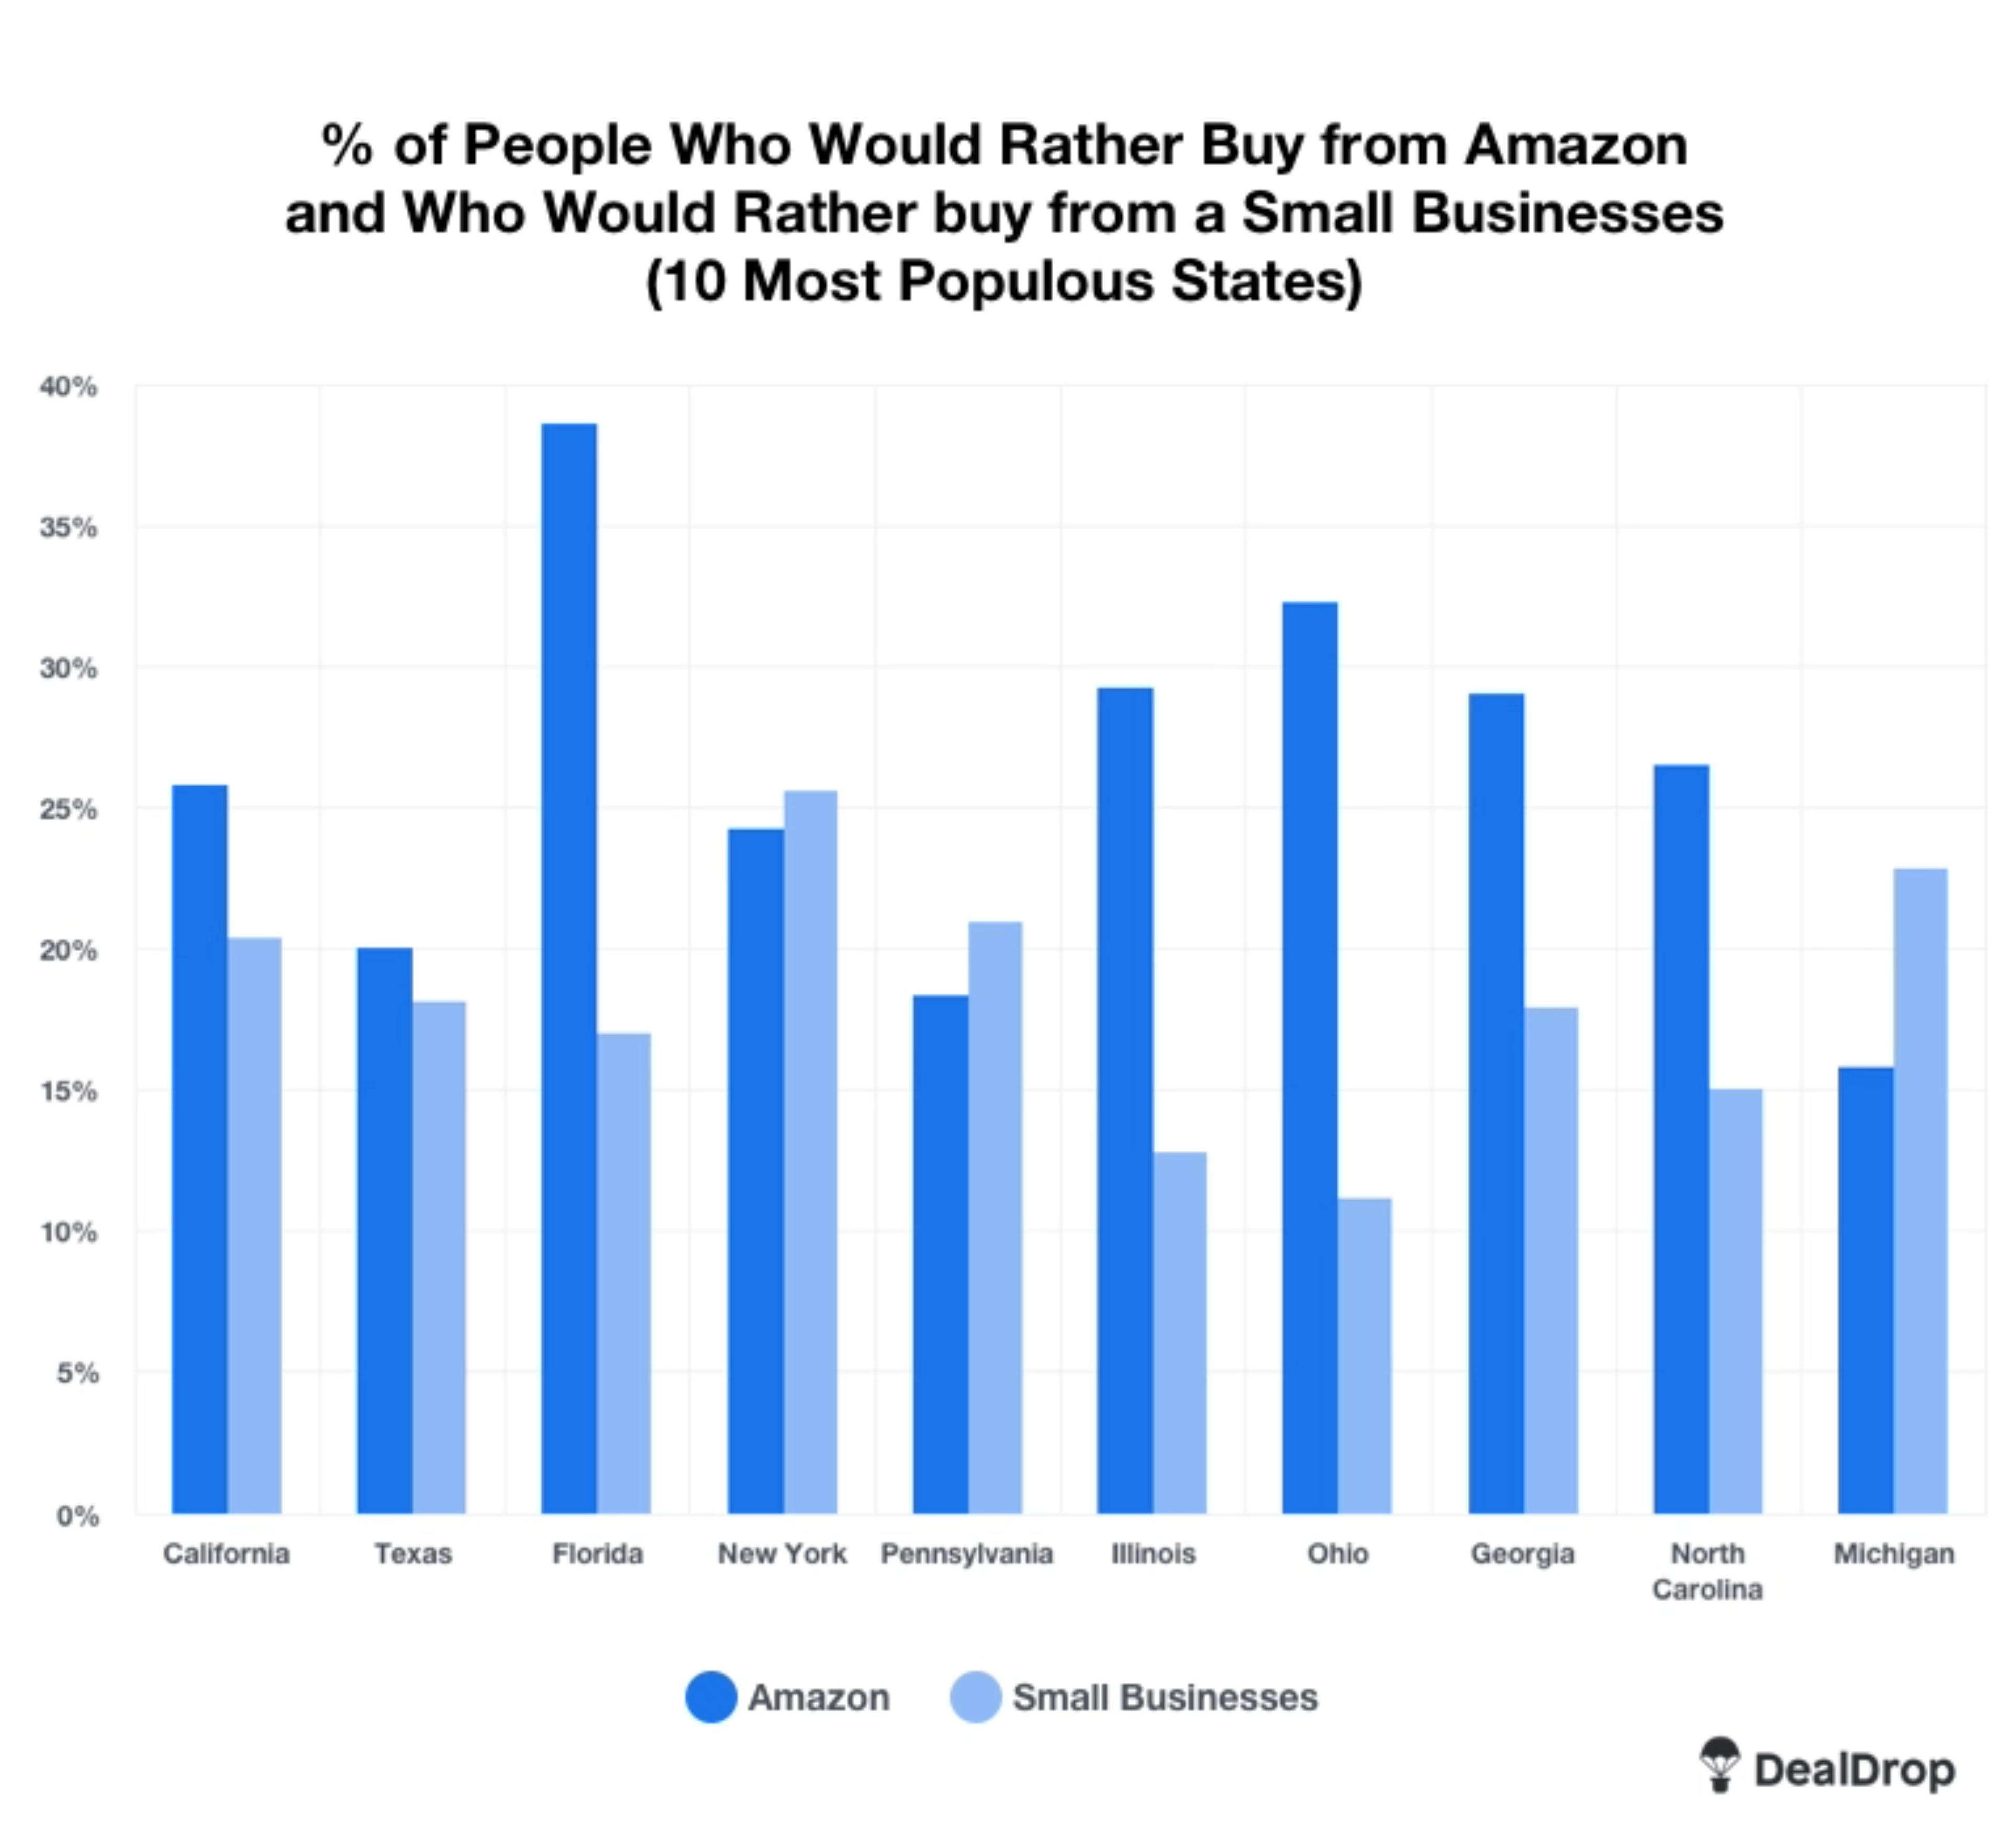
% Who Would Rather Shop on Amazon than any other Website VS Who Would Rather Buy from Small Businesses
| Amazon | Small Business | |
| California | 25.21% | 20.3% |
| Texas | 20.0% | 18.01% |
| Florida | 38.71% | 16.3% |
| New York | 24.2% | 25.8% |
| Pennsylvania | 18.5% | 20.8% |
| Illinois | 29.4% | 12.9% |
| Ohio | 32.3% | 11.2% |
| Georgia | 29.0% | 17.6% |
| North Carolina | 26.1% | 15.0% |
| Michigan | 15.9% | 23.54% |
In 3 of the 10 most populous states (New York, Pennsylvania and Michigan) more people stated a preference to buy from small businesses than states a preference to buy for Amazon.
This was most pronounced in Michigan where just 14.2% stated a preference for Amazon and 20.5% for small businesses.
What Proportion of Sales are Online in the USA?
So what proportion of retail sales are now online in the US?
In 2020, 227.5 million Americans aged over 14 shopped online with this figure expected to increase to 230.5 million by the end of 2021. This means that of the American population aged 14 or over, (268 million people), 86% will shop online in 2021. That’s a phenomenal market size.
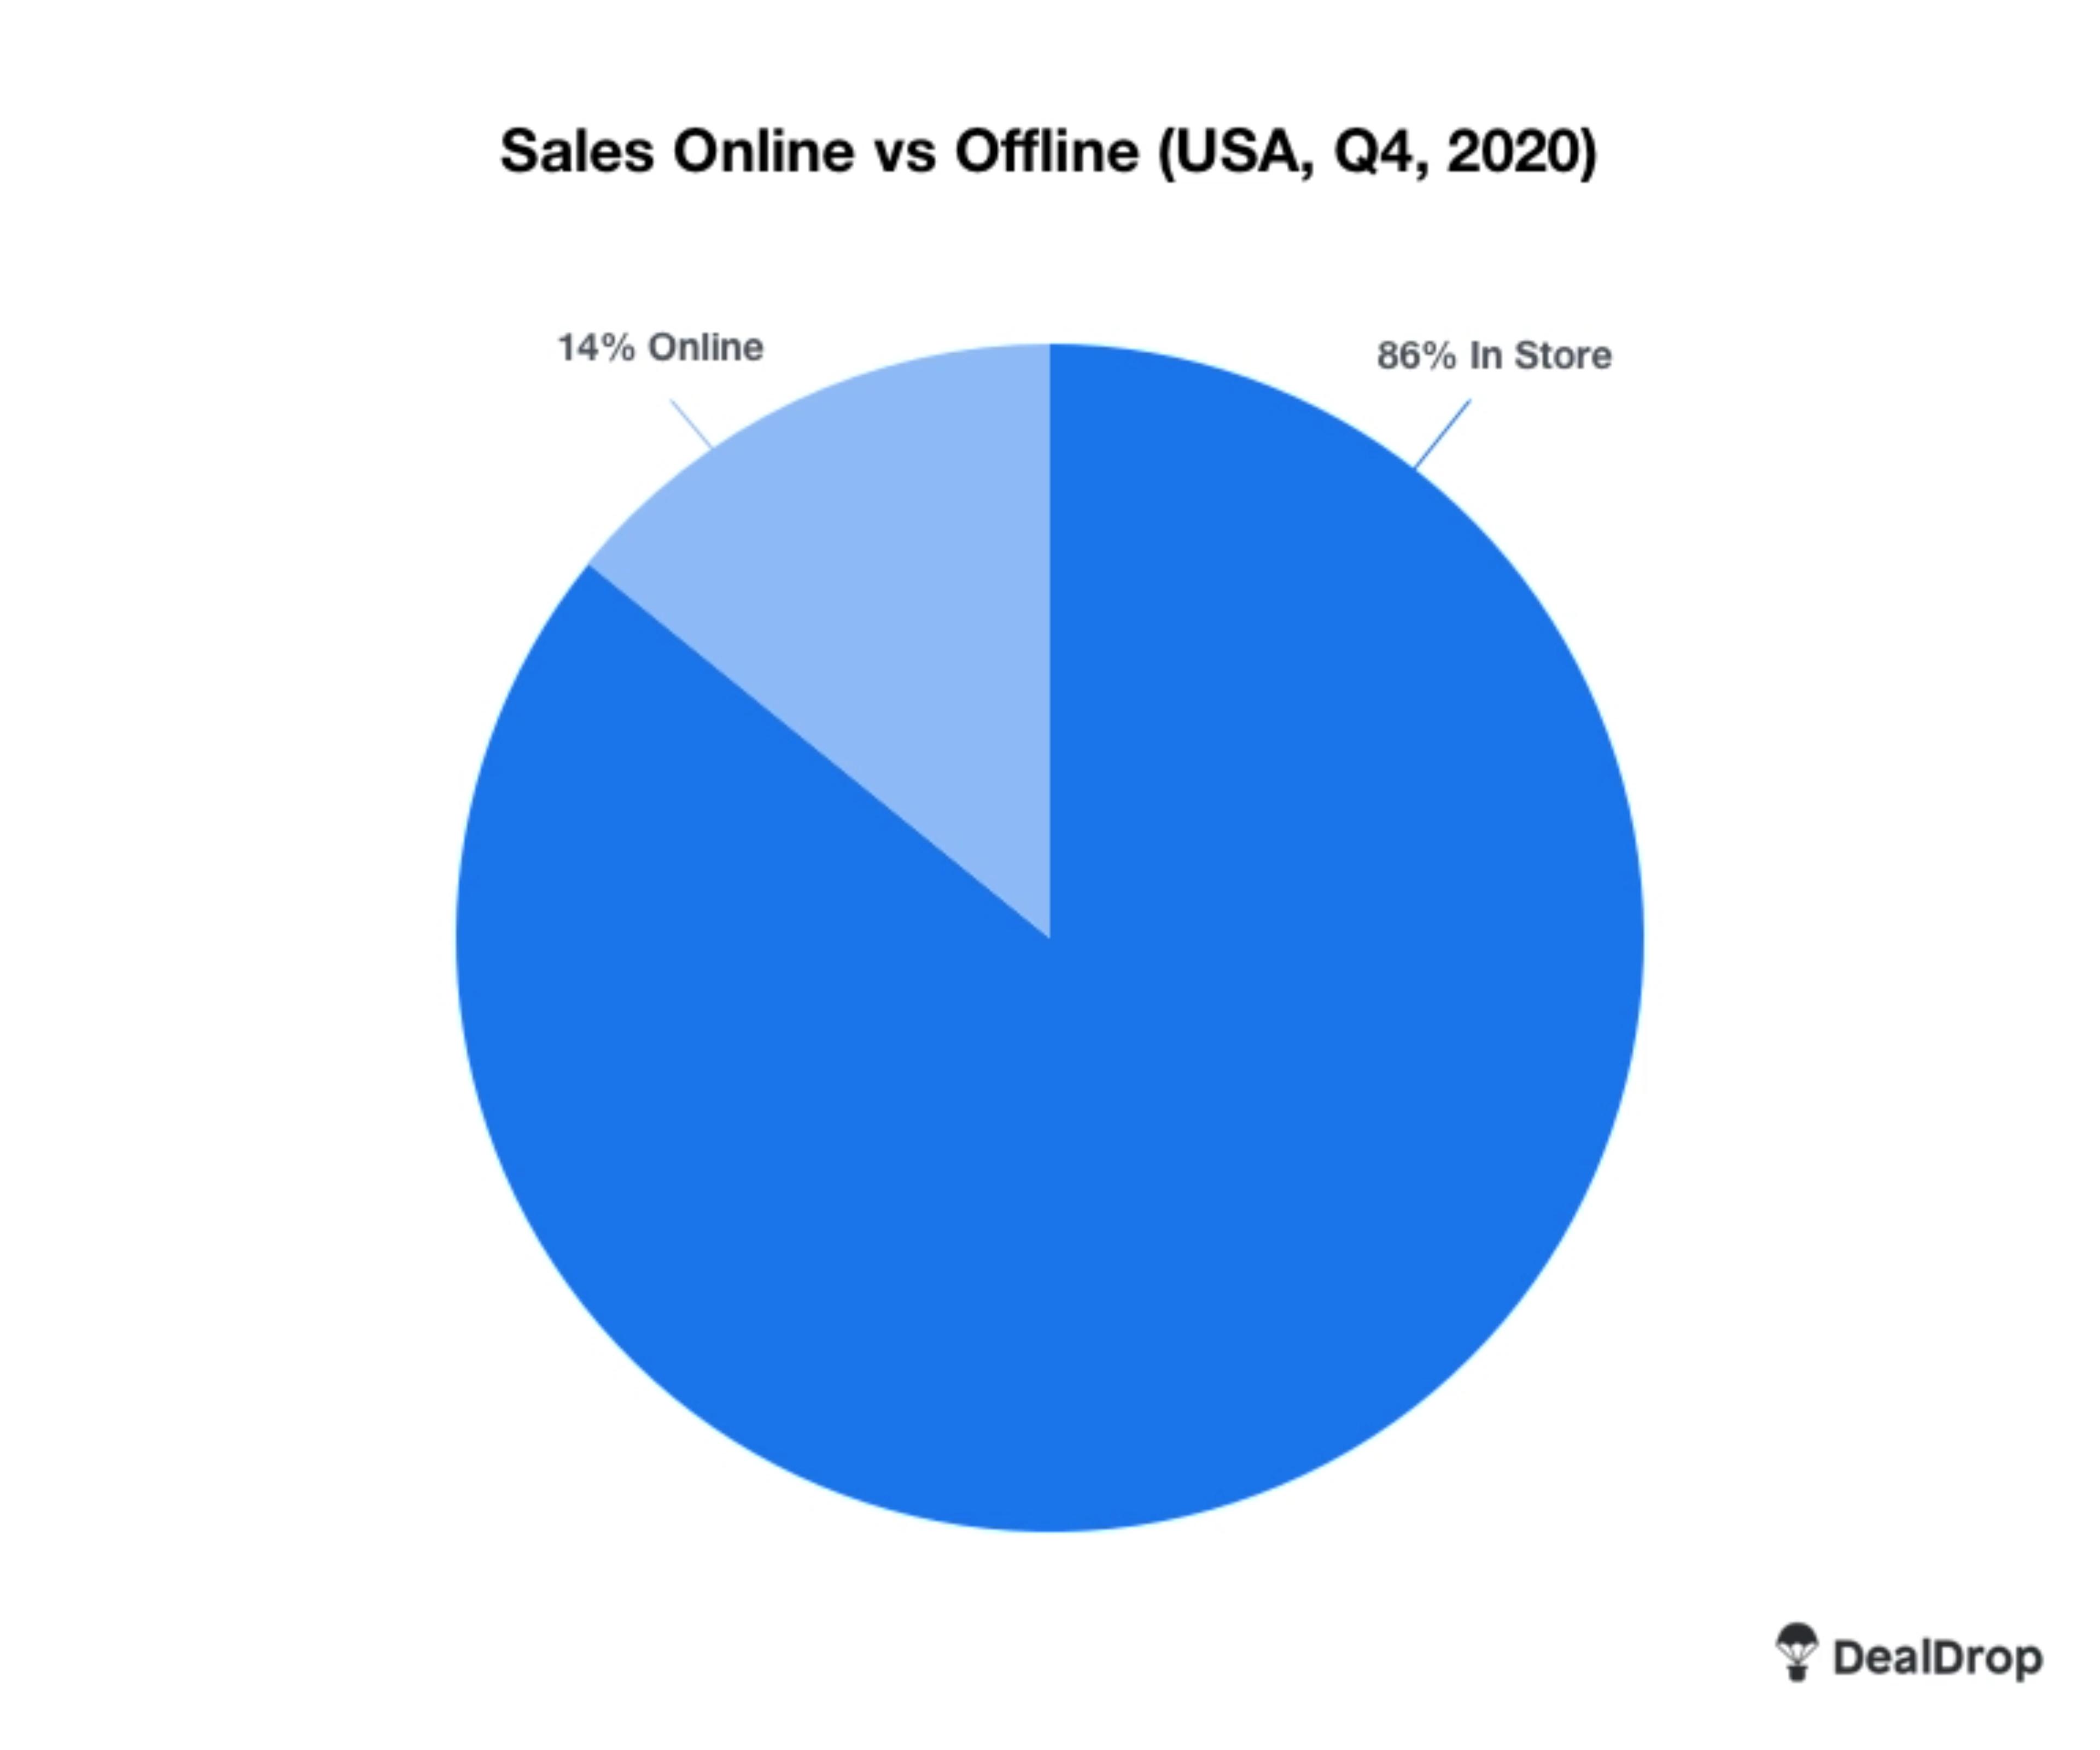
Furthermore, in Q4 2020, 14% of all purchases were made online in the USA which has almost doubled from 2015 where only 7.5% of all sales were made online.
Who are the Most Popular Online Retailers in the USA?
But what are our favourite stores? Profits only tell part of the story and don’t necessarily give us a picture of popularity (some stores have higher margins etc). But we can always count on Google to give us an insight into the mindset of the many
So we used kwfinder.com to look up the average number of searches per month for the USA’s biggest retailers to determine who the most popular online retailers are in the USA:
| Keyword | Average Monthly Searches USA (Average of past 12 months) |
| Amazon | 133,000,000 |
| Walmart | 68,500,000 |
| Home Depot | 46,900,000 |
| Target | 33,100,000 |
| Best Buy | 27,600,000 |
| Lowes | 23,900,000 |
| Costco | 17,900,000 |
| Walgreens | 13,800,000 |
| Macys | 13,800,000 |
| Kohls | 11,800,000 |
| Wayfair | 9,490,000 |
| Autozones | 8,310,000 |
| CVS | 8,100,000 |
| Nordstrom | 7,000,000 |
| Dollar Tree | 6,630,000 |
| TJ Maxx | 6,400,000 |
| Verizon | 6,100,000 |
| Menards | 5,960,000 |
| Dollar General | 5,840,000 |
| Apple | 5,440,000 |
| Dicks Sporting Goods | 4,780,000 |
| Office Depot | 4,760,000 |
| Staples | 4,670,000 |
| Ace Hardware | 4,610,000 |
| Kroger | 4,540,000 |
| QVC | 4,280,000 |
| Publix | 4,090,000 |
| AT&T | 3,600,000 |
| Aldi | 3,360,000 |
| BJs | 2,700,000 |
| Burlingon | 2,150,000 |
| Meijer | 2,060,000 |
| Rite Aid | 2,030,000 |
| HEB | 1,840,000 |
| Sherwin Williams | 1,830,000 |
| Gap | 1,710,000 |
| Shoprite | 1,490,000 |
| Foot Locker | 1,330,000 |
| iTunes | 1,160,000 |
| Wegmans | 1,080,000 |
| Albertsons | 992,000 |
| Bed Bath Beyond | 870,000 |
| PatSmart | 787,000 |
| Giant Eagle | 694,000 |
| Kmart | 494,000 |
| Save A Lot | 488,000 |
| JC Penney | 477,000 |
| Victoria’s Secret | 447,000 |
| Ross Stores | 272,000 |
| Hy Vee | 148,000 |
Amazon is the most searched online retailer in the USA, accumulating 133 million searches per month in the states, almost double that of the second largest retailer (Walmart). In terms of revenue for the online giant, this relates to an annual revenue of $386 billion in 2020 alone. In America, the population is roughly 328 million people as of April 2021, resulting in over 40% of the population searching for the online store every month.
Summary: Ecommerce Statistics roundup USA 2021
The online shopping space is phenomenally huge and growing at a fast rate. And while online retail behemoths like Amazon certainly take a chunk of the market, there’s a solid base of customers for small businesses too.
Online shopping accounts for double the proportion of overall retail sales that it did just 5 years ago and many of us shop regularly and spend more in the online shopping space.
So what will this look like in 2022?
Our bet would be on more growth!
Methodology and Caveats
- We surveyed 3,001 people in the USA using Google Surveys between 18th March and 14th April
- For search popularity figures, we conducted a keyword analysis using KWFinder. We started with a list of the top 100 retailers in the USA and, based on their brand keyword search data from kwfinder.com, narrowed this down to the top 50 by search popularity
If you’d like to see anymore data from this piece or request any further comment, please contact hello@dealdrop.com


